GC-MS/MS analysis methods for OCPs, PAHs, and PCBs in environmental samples
Inge de Dobbeleer, Joachim Gummersbach, Hans-Joachim Huebschmann, Anton Mayer, Paul Silcock Thermo Fisher Scientific, Dreieich, Germany
Key words
Organochlorine insecticides, polychlorinated biphenyls, polycyclic aromatic hydrocarbons, soil samples, water samples, building materials, repeatability, linearity
aims
This paper describes the analysis of semi-volatile compounds in a variety of environmental matrices, demonstrating the high productivity and high quality results of GC-MS/MS systems.
Introduction
Organochlorine pesticides (OCP), polycyclic aromatic hydrocarbons (PAH), and polychlorinated biphenyls (PCBs) are familiar to both routine environmental monitoring laboratories and contract testing laboratories. These laboratories have tried various approaches to address the detection of these classes of compounds in a variety of environmental matrices.
Gas Chromatography-Mass Spectrometry (GC-MS) is ideal for the detection of OCPs, PAHs, and PCBs. Compared to conventional detectors, such as HPLC UV and fluorescence detectors, and GC's ECD and FID detectors, single quadrupole GC-MS systems have provided environmental monitoring laboratories with an opportunity to improve the analysis of these compounds. This allows for a limited simplification of the sample preparation process to increase sample throughput and ultimately reduce laboratory costs.
Compared to the single quadrupole GC-MS, the triple quadrupole GC-MS/MS system improves the selectivity of the compound more significantly. Good selectivity is critical to the effective detection of target compounds from the background, and thus enhances the detection capabilities and productivity of environmental monitoring laboratories. More and more laboratories are choosing this technology, especially those that want to be one step ahead of the competition. Unfortunately, for new laboratories that are exposed to GC-MS/MS technology, it is a challenge to adopt new technologies and achieve productivity improvements without significantly affecting the continuous operation of the laboratory.
This application note describes a GC-MS/MS method based on the Thermo ScientificTM TRACETM 1310 GC and TSQTM 8000 Triple Quadrupole GC-MS/MS systems. This method enables high-performance, high-output analysis of OCPs, PAHs, and PCBs in environmental samples.
The paper also describes the use of intelligent software tools integrated into method development and analysis processes that effectively reduce the time required to establish and maintain routine test methods.
Experimental condition
Sample Preparation
Water sample
Add n-hexane to the 1 L sample and mix. After the aqueous phase and the organic phase were sufficiently phase separated, the organic phase was removed and dried over anhydrous Na 2 SO 4 . An organic extract was concentrated by evaporation to 3–4 mL and evaporated to a final volume under a gentle stream of nitrogen.
Solid sample
Weigh 10 g of sample (soil, sediment, or building material) in a glass vial, then add anhydrous Na2SO4 and 40 mL of mixed extraction solvent (hexane and acetone). The glass bottle mouth was sealed with a taifu ç‘ sealing film and ultrasonically shaken for 20 min. Place one portion of the extract in the Kuderna – Danish equipment, add 40 ml of the mixed extraction solvent to the sample and repeat the extraction once. A second extract was mixed with one extract, concentrated by evaporation to 3–4 mL, and evaporated to a final volume under a gentle stream of nitrogen.
Method setting
Developed methods for Thermo Scientific TRACETM 1310 Gas Chromatography and TSQ8000 mass spectrometers (Table 1).
Table 1. Recommended instrument method settings
TRACE 1310 GC |
Injection volume 1 μL |
Liner Siltec baffled liner (P/N 453T2120) |
Carrier gas He, constant current mode, flow rate 1.15 mL/min |
Column type 20 m, 18 mm ID, 0.18 μm df, TG-XLBMS (P/N26079-5780) |
The column oven starts at 60 ÌŠC for 1 min. The temperature was raised to 200 ÌŠC at 30.0 ÌŠC/min, and the temperature was raised to 320 ÌŠC at 10.0 ÌŠC/min. Hold for 2.0 min. |
Conveying line temperature 320 ÌŠC |
TRACE 1310 GC PTV program |
Injector temperature 80 ÌŠC, splitless injection 1 min |
PTV injection 80 ÌŠC, 0.1 min. 600 ÌŠC/min until delivery step |
PTV transport 320 ÌŠC, 5 min, 870 ÌŠC/min to the cleaning step |
PTV cleaning 325 ÌŠC, 15 min, cleaning flow rate 25 mL/min |
TSQ 8000 mass spectrometer EI mode |
Source temperature 350 ÌŠC |
Ionization EI, 70 eV |
Emission current 50 μA |
Resolution Q1 is normal |
Collision gas argon gas |
Method : mass spectrometer acquisition method and quantitative method
With the TSQ 8000 GC-MS/MS system, users can automate the development of SRM methods, significantly reducing method development time. AutoSRM speeds up the method development process. The optimized parameters are recorded in a fully automated format in an excel form. The program begins with a full sweep analysis that identifies the peaks through a library search. Clicking on each peak will display the list of the most abundant ions, which will be pushed into a worklist for secondary injection, ie product ion scanning.
The result will generate a chromatogram again, click on the chromatogram peak to see a list of product ions summarized in a decreasing abundance. Finally, these product ions are pushed into the next work list, and the final optimization process begins with the application of progressively higher collision energy to these ions. The results will be displayed graphically and a third list of jobs will be generated. Selecting this job list will create an SRM method for all compounds and connect to a complete instrument method. In addition, ion pairs and retention times are exported to a list of compounds that are automatically linked to quantitative methods in Thermo Scientific TraceFinderTM software.
A complete description can be found in the application brief AB52998: AutoSRM debut: easy-to-use MRM brings excellent results.
Tuning
The TSQ 8000 GC-MS features a complete auto-tuning feature that ensures repeatability of the tuning even when used by different users. The tuning function includes automatic column churn detection, primarily by monitoring the natural air/water background and the proportion of gas introduced into the source by a meter.
The tune file is automatically stored in the instrument. The instrument file is associated with the most recent tune file by default, but it can also be manually selected to be associated with other tune files.

Results and discussion
Method output and performance
The goal of this analytical method is to help laboratories reduce the total workload generated by analyzing large numbers of compounds. To effectively analyze the material in this entire compound list, we used TRACE 1310 GC and TG-XLBMS columns to optimize the separation of key isomer pairs.
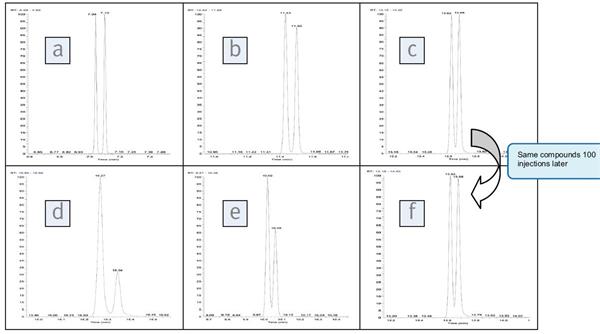
Figure 2. Chromatogram of the target compound in the standard with an absolute injection volume of 2000 pg; except benzo(b) and (k) fluoranthene are 400 pg standards in building materials.
After 100 injections of the same compound
a: phenanthrene and decene
b: 屈和苯和a 蒽
c: benzo (b) and benzo-k fluoranthene
d: 茚(1,2,3-cd) 芘 and dibenzo(a,h) 蒽
e: o, p DDD and p, p DDT
f: benzo (b) and benzo (k) fluoranthene in building materials
The entire chromatogram showed that all compounds eluted within 17 minutes. The same chromatographic separation results were obtained after 100 injections of water, soil and building material extracts.
Calibration curve
OCP and PCB calibration curves were prepared at concentrations ranging from 2 μg/L to 700 μg/L. PAH requires a higher range of 2 μg/L to 2,500 μg/L. There is no calibration of the internal standard curve.
The linear correlation coefficients of all curves are greater than 0.995. The curves for some of the target compounds are shown in Figures 3 and 4.
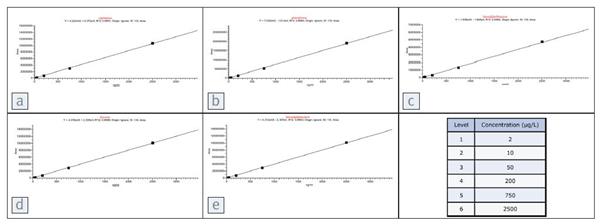
Figure 3. Calibration curves for various PAHs. Each compound and its corresponding linear correlation coefficient is
a: naphthalene, R2=0.9991
b: Philippine, R2= 0.9994
c: benzopyrene, R2 = 0.9985
d: 芴, R2= 0.9998
e: benzopyrene, R2= 0.9993
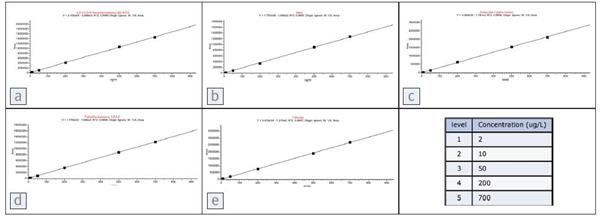
Figure 4. Calibration curve for various pesticides. Each compound and its corresponding progressive coefficient is
a: PCB153, R2=0.9999
b: Aldrin, R2 = 0.9993
c: a-endosulfan, R2= 0.9996
d: tetrachlorobenzene, R2 = 0.9999
e: trifluralin, R2 = 0.9999
Compound level is 2 μg/L
The lowest calibration level is 2 pg on a 2μg/L column, and all compounds respond very well with a high signal-to-noise ratio. Figure 5 shows some extracted SRM chromatograms at this concentration.
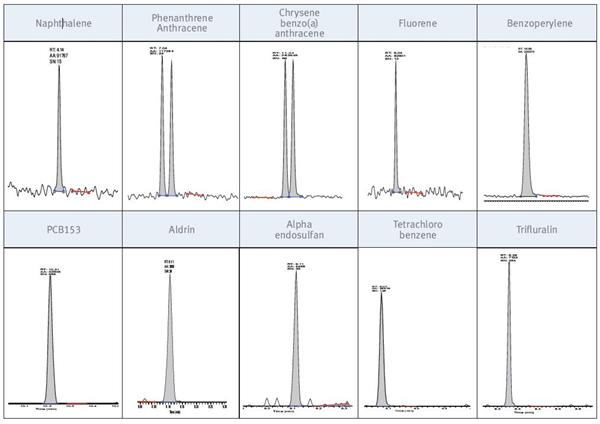
Figure 5. Peak at a concentration of 2 μg/L; absolute injection on the column is 2 pg
Accuracy of detection of standards added to the matrix
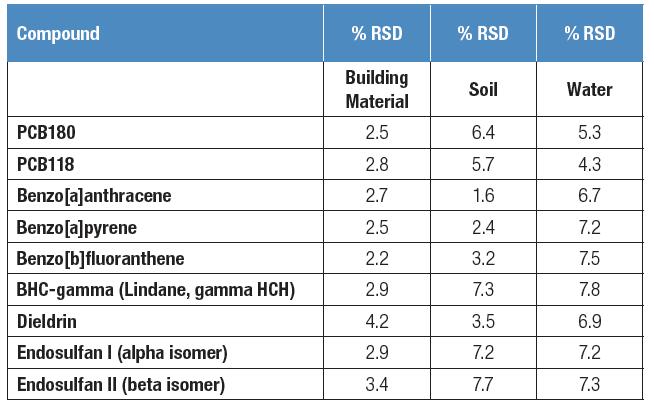
In all three matrices, reproducibility was established by repeated injections of standard-added soil extracts, aqueous extracts, and building material extracts. All samples were analyzed 7 times and RSD was calculated by external standard method (Table 2).
The repeatability of all compounds in the matrix is ​​shown to be less than 10% RSD. Peak area integration is fully automated by TraceFinder software without any manual intervention.
Table 2. Relative standard deviation of 7 different matrix samples
Ion ratio stability
All compounds have at least two ion pairs in the method, and two ion pairs were monitored in all samples, blanks, and standards.
Hexachloroethane | Ratio | Benzoperylene | Ratio |
Average | 0.479 | Average | 2.910 |
Standard deviation | 0.025 | Standard deviation | 0.124 |
RSD | 5.3% | RSD | 4.3% |

Figure 6. The ion ratio of hexachloroethane, which also shows the upper and lower limits of the EU analytical method performance guidelines. The mean and standard deviation are listed in the table above.
We calculated the ion ratios for all calibration curves, water samples, soil samples, and building material samples. The accuracy of the ion ratio confirms all samples and standards throughout the concentration range.
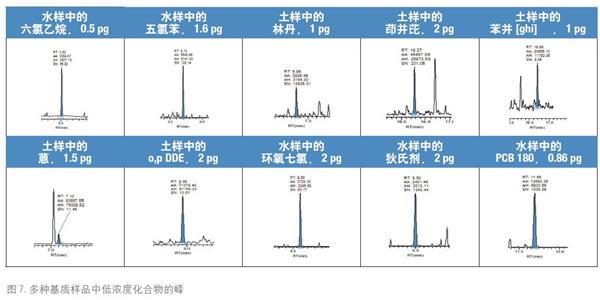
Result instance
The peaks of the low concentration compounds in a portion of the matrix samples are shown in Figure 7, demonstrating that the sensitivity and selectivity of the measurement methods are good.
Part of the sample matrix, low concentration compounds, and concentration values ​​are given below, and the concentration values ​​are given as absolute amounts on the column.
in conclusion
• TSQ 8000 GC-MS/MS supports simplified method development, verification, and management operations through a variety of integrated software tools.
• Simplify three injections into one injection by combining three separate methods, and the new method increases lab productivity.
• The system's quantitative capabilities and methods are excellent, linear and sensitive, and maintain high accuracy and precision in a variety of environmental samples.
references
1. Analysis of emerging persistent organic pollutants using GCMS/MS; Kalachova et al. SETAC, Berlin 2012.
2. Ziegenhals, K.; Hubschmann, HJ Fast-GC/HRMS to quantify the EU priority PAH. J. Sep. Sci. 2008, 31, 1779 – 1786.
3. Thermo Scientific Application Brief AB52998: Introducing AutoSRM: MRM Simplicity for High Performance
Results; Cole J.
4. REGULATION (EC) No 2002/657 on analytical performance criteria.
5. Pesticides Method Reference, 2nd ed. 2011, Thermo Fisher Scientific, Austin, TX, USA, P/N 120390.
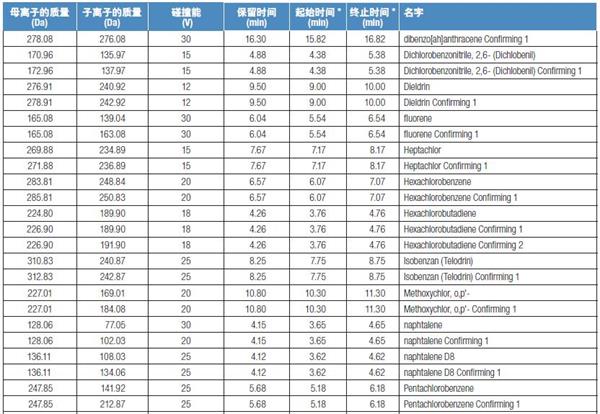
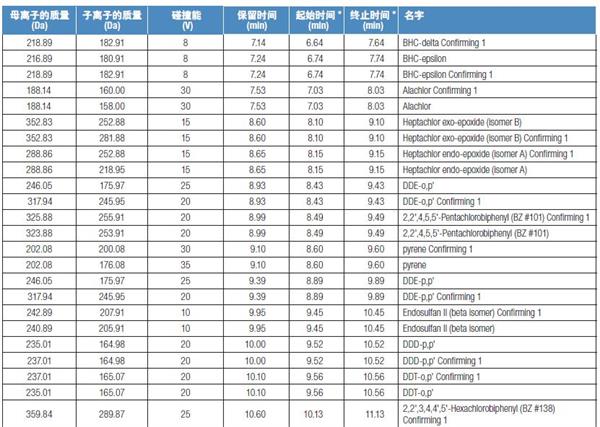
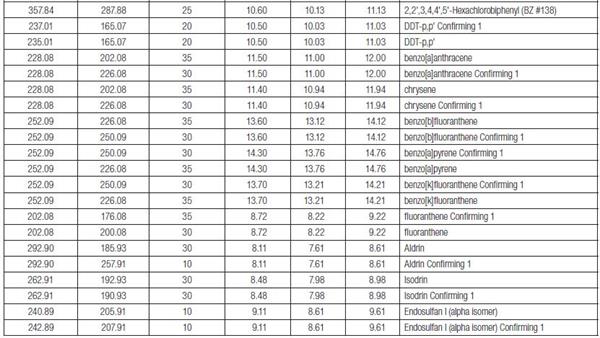
Schedule: SRM ion pair


Thermo Fisher Scientific (China) Co., Ltd.
Free service hotline: 800 810 5118
400 650 5118 (support mobile phone users)
Application Note 52389
Small Molecule Peptides Powder
Small molecule peptides powder:Bovine bone oligopeptide powder,Fish collagen peptide powder,Sunflower disk oligopeptide powder,Oat protein peptide powder,Corn oligopeptide powder,Soybean peptide powder,Whey protein peptide.
Small Molecule Peptides Powder,Collagen Peptide Powder,Small Molecule Oligopeptide Powder,Marine Collagen Peptides Protein Powder
Shaanxi Zhongyi Kangjian Biotechnology Co.,Ltd , https://www.zhongyibiology.com